

Dashboards
Have documents for meetings, arguments for leadership and certainty when planning
Time saving — reports on clicks and numbers that update themselves.
Maximum clarity — the data in graphs and visualizations can be understood by everyone at a glance.
Smart decisions - with precise numbers, you know when to intervene and where the reserves are.
What does the module do?
The Dashboards module allows you to work with clear, verified data instead of guesswork. You will get detailed overview of the composition of employees, their beginnings and success, departures and reasons for turnover, but also about the quality of the data itself. Oh, thanks interactive charts and export documents are always at hand, whether for management consultations, recruitment planning or evaluating the effectiveness of HR processes.
This will give you the opportunity to make decisions faster and more confidently, uncover hidden connections and respond in time to problems that would otherwise cost time and money. Dashboards take you from operative to real Strategic HRThis has a real impact on the growth and stability of the entire company.
What reports do you get
People in the company
This dashboard shows you what your business really looks like in a few seconds.
At a glance, you can see everything you need:
- Total number of employees — always up-to-date overview of the size of the company.
- Extraordinary states — who is on parental leave, long-term sick leave or temporarily absent.
- Distribution by gender — a quick overview of the team structure.
- Average length of employment — a clear answer to how long people stay with you.
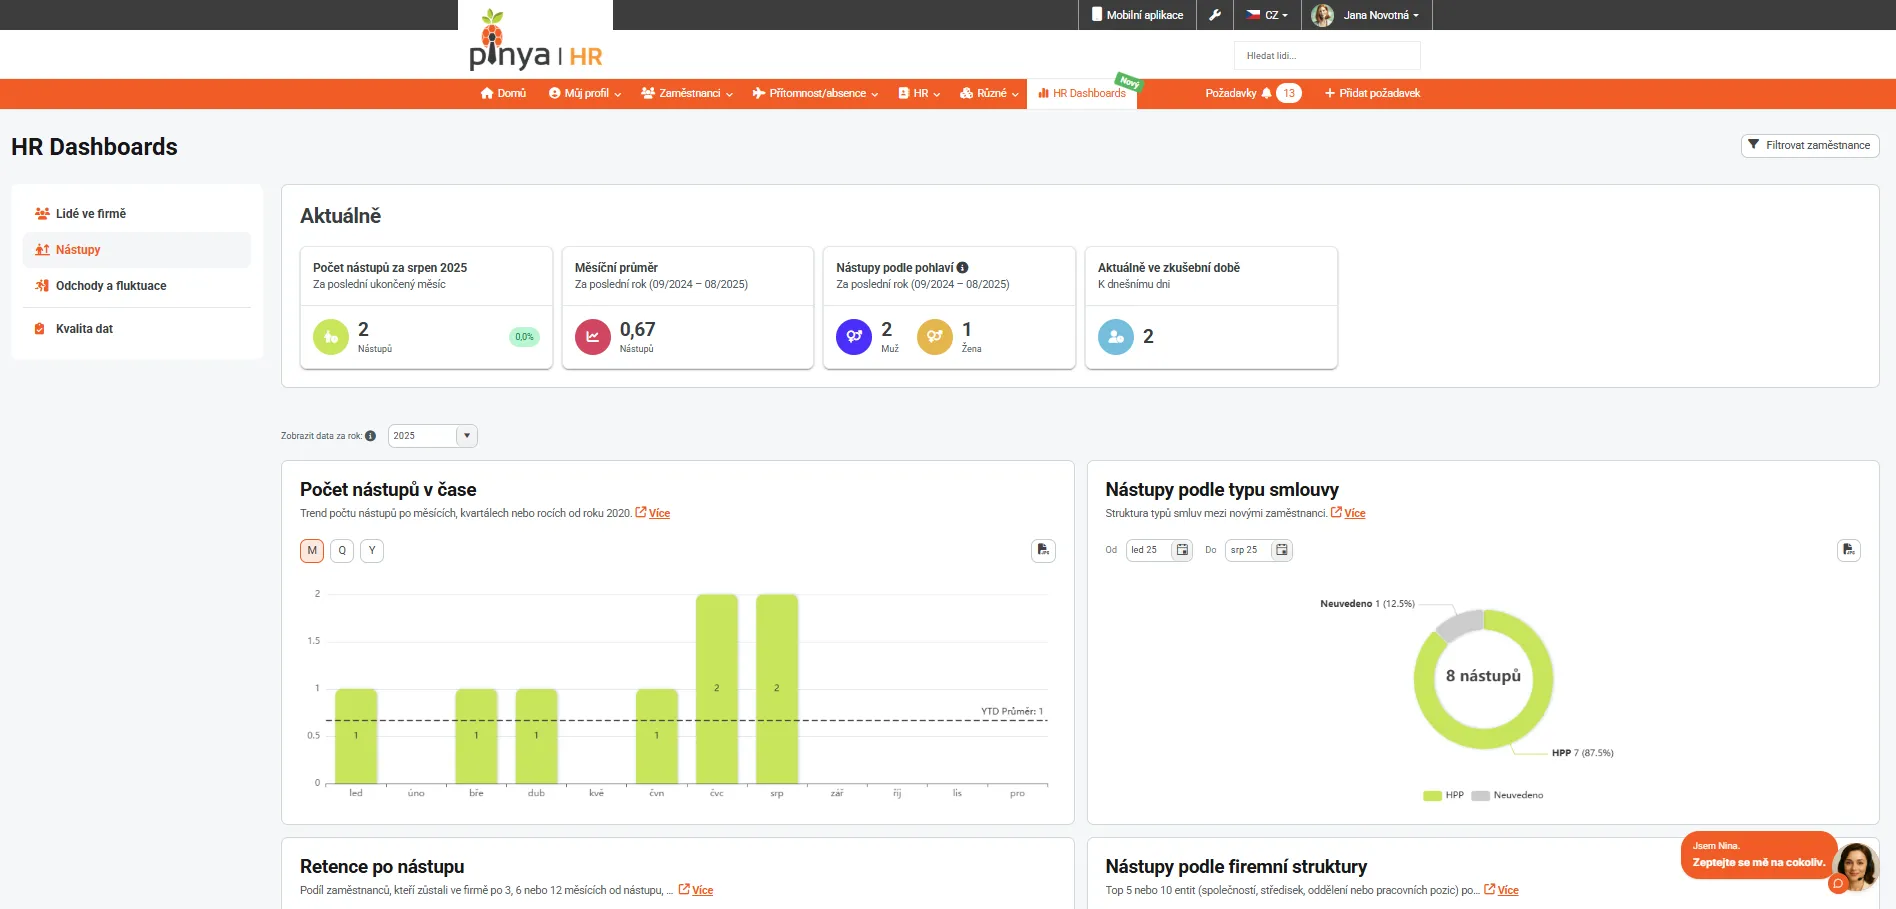
Onsets
How fast is your business growing? And how many new people actually stay with you? This dashboard gives you a clear overview of the starts and helps to see if the number of chairs is growing or the stability of the team is growing.
- Number of starts in time — months, quarters, or whole years.
- Arrivals by type of contract — you can see who has joined the HPP, DPP or other regime.
- Post-Onset Retention — how many newcomers remain after 3, 6 or 12 months.
- Startups by company structure — by companies, departments, centers or positions.
Thanks to the filters, you can adjust the view exactly as you need — just for the 1st quarter or a specific department.
Departures and fluctuations
Keeping track of why and how many people are leaving the company is key. This dashboard shows you more than just numbers — it helps you uncover trends, reasons, and weaknesses to start working on.
Charts will give you context.
- Track the number of departures in time — by months, quarters and years.
- Find out the reasons for departures — let you know if it's about wages, leadership, or other factors.
- Watch the evolution of the fluctuation — once a month, or cumulatively since the beginning of the year.
- Break down the numbers by company structure — companies, departments, positions.
Thanks to filters, you can go back in time and set your view exactly as you need.
Data quality
Missing data in HR data? Inaccurate dials? All this can distort the results of further analyzes. This dashboard will give you a clear overview of how high quality data you really have in your company.
What does it show?
- Work data — check whether key information about employees is missing.
- Personal data — fast detection of unfilled fields.
- Dials — Verify that your data is set correctly.
Each indicator has its own graph, which will immediately show how many errors or empty fields are hidden in your system. When you click on the chart, you will see a table with a list of employees who are missing data or have errors.
The point? You no longer have to grope where the holes are in the data. You can see them at a glance and you can fix them right away. And only with quality data, then all further analysis makes sense.


.webp)

.webp)


